
Time-series forecasting
Estimate demand or workload at the time intervals your operations require, with seasonal patterns and external signals where available.
AI Predictive Analytics
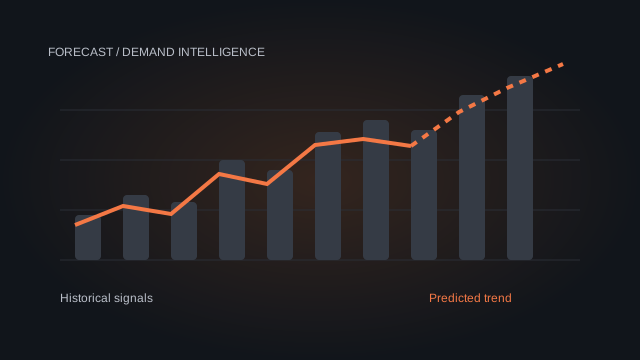
Turn historical data into forecasts for demand, customer behavior, and operational planning. We build prediction models, validate their performance, and present insights through dashboards your team can use.
BUSINESS CONTEXT
Abronsys builds forecasting and predictive models that connect your historical records to practical planning decisions. We examine seasonality, missing data, changing customer behavior, and the cost of an incorrect prediction before selecting a modeling approach. Forecasts are delivered with context and uncertainty, so teams can use them alongside their business judgment.
Support inventory planning, staffing, and customer retention with earlier signals. Success is measured against a simple baseline and the operational cost of forecast errors.
WHAT ABRONSYS PROVIDES
Demand forecasting · Churn signals · Resource planning
Estimate demand or workload at the time intervals your operations require, with seasonal patterns and external signals where available.
Prioritize customer retention or operational reviews using agreed signals and interpretable scores.
Compare forecasts with observed results, review error patterns, and export estimates into planning workflows.
Track input quality, forecast drift, and retraining needs after deployment.
INTERACTIVE PREVIEW
This animated chart uses synthetic sample data to demonstrate reporting for ai predictive analytics. It is not a live integration, model benchmark, or a claim about client results.
Your production dashboard would use agreed metrics, connected data sources, and access controls.
Actual demand against a sample forecast · orders
Thu: Actual 73 orders · Forecast 77 orders
Select a channel to inspect its share.
Web contributes 46% of the sample demand.
Inspect the selected period’s forecast error.
Thu · Forecast minus actual: 4 orders
Orders by day and time block. Select a cell for its value.
Thu, 10–14: 12 orders
Low intensity ░ → ▓ High intensity
Illustrative score relationship, not evidence of causation.
Engagement 52 · Demand 61 / 100
| Period | Actual | Forecast | Difference |
|---|---|---|---|
| Mon | 42 | 47 | 5 |
| Tue | 58 | 55 | -3 |
| Wed | 51 | 57 | 6 |
| Thu | 73 | 77 | 4 |
| Fri | 67 | 62 | -5 |
| Sat | 84 | 88 | 4 |
| Sun | 78 | 85 | 7 |
TECHNOLOGY & DELIVERY
These are possible technologies. Final choices follow a review of your infrastructure, budget, data, and deployment constraints.
Historical transactions, timestamps, business events, and agreed target variables. The available history determines the level of seasonality and segmentation we can model.
A documented data pipeline, evaluated baseline and candidate models, a forecasting API or scheduled output, and a dashboard with operating guidance.
We connect the AI capability to your application and workflow, with documented scope, reviewable milestones, evaluation criteria, and a practical handover. Ongoing support is defined around your operating needs.
OUR APPROACH
Check data coverage, leakage, anomalies, and the decision the forecast will support.
Compare models using chronological validation and business-relevant error measures.
Integrate forecasts into dashboards, APIs, or scheduled reporting.
Review actuals against forecasts and agree when models should be updated.
It depends on the forecast horizon, seasonality, and volume. Discovery identifies whether the available history supports a useful model or whether data collection should come first.
No. Forecasts are estimates. We evaluate errors, communicate uncertainty, and define how teams should respond when conditions change.
Share your use case and existing systems. Abronsys will clarify data availability, integration needs, success criteria, and a scoped plan before estimating implementation.
We agree maintenance responsibilities, monitoring, update procedures, and support expectations. Model or workflow changes are reviewed against the original evaluation criteria.
START A CONVERSATION
Talk to Abronsys about ai predictive analytics. Tell us about your users, data, and the outcome you want to improve.
Fill out the form below. Your enquiry will instantly reach our Noida software team and admin inbox!